Web Performance Metrics Explained: From FCP to CLS for Better User Experience
Introduction
As I began to study the fundamentals anew, I had intended to set aside topics related to web optimization. I felt that addressing optimization was premature while focusing on building a solid foundation after dismantling a shaky structure.
However, while deliberating on the frameworks to use for my project, I noticed terms associated with performance metrics emerging as I explored the advantages of each framework. Seizing this opportunity, I aim to consolidate my understanding of various performance metrics that I had previously only skimmed over.
For now, I will focus solely on defining these performance metrics, while the study of optimization methods will be reserved for later.
Lighthouse
Lighthouse is an open-source, automated tool for improving the performance, quality, and correctness of your web apps.
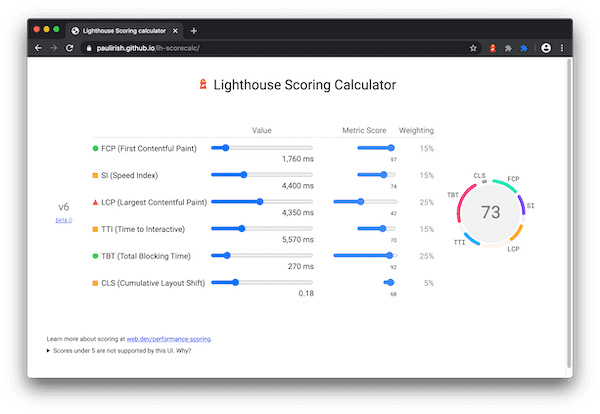
Lighthouse Scoring Calculator
In simple terms, Lighthouse is a tool that measures the performance of a specific website.
In this article, I will explore the metrics provided by the Lighthouse tool.
FCP (First Contentful Paint)
- The time taken for a portion of the page content (text, images) to be rendered on the screen after a user visits the site.
- Aim for a time of less than 1.8 seconds.
Unlike First Paint (FP), which measures when the first pixel appears on the screen, FCP measures the time it takes for elements included in the DOM to be displayed.
SI (Speed Index)
- A metric that measures how quickly the content of a page is visually filled.
- Although the completion time of the page remains the same, the score may vary based on the process.
- Its significance has diminished with the rise of SPAs, where only modified sections are updated.
LCP (Largest Contentful Paint)
- The rendering time of the largest image or text block displayed on the screen.
- Unlike other metrics that measure the paint time, LCP focuses on the largest content.
- Aim for a time of less than 2.5 seconds.
TTI (Time To Interactive)
- The time it takes for the page to stably respond to user input.
- While SSR allows content to be displayed quickly, thread blocking or unexecuted JavaScript can hinder interaction, leading to increased TTI.
- To ensure a pleasant user experience, it is crucial to minimize the difference between FCP and TTI.
- Aim for a time of less than 5 seconds.
FID (First Input Delay)
- The time taken from when a user first interacts to when the browser begins processing the event handler.
- Focuses solely on the first input (click, tap, key press).
- While TTI measures the time until the main thread becomes available for interaction, FID measures the time taken for actual user input and the response to that input.
- Aim for a time of less than 100 milliseconds.

TTI vs FID Timing Differences
TBT (Total Blocking Time)
- The total time that the main thread is blocked enough to prevent user input after FCP.
- As illustrated in the figure below, short thread blocking times are disregarded.
- Aim for a time of less than 200 milliseconds.

Total Blocking Time
CLS (Cumulative Layout Shift)
- A score that quantifies all unexpected layout shifts that occur throughout the lifespan of the page.
- Aim for a score of less than 0.1.
- Significant user issues can arise from layout shifts (see example: CLS ISSUE).
Conclusion
There was a time when I believed that simply designing an appealing UI was sufficient for enhancing user experience. However, this opportunity has led me to realize that developers can improve UX not only through visual design but also through various other aspects.
While I have only covered the conceptual definitions of these metrics for now, I intend to diligently study optimization strategies in the future.